In the business landscape, organizations are flooded with more information than ever before. Yet, many executive teams find themselves “data rich but insight poor.” The challenge lies not in gathering data, but in translating complex metrics into a cohesive narrative that guides strategic action.
For business leaders in Australia and globally, the ability to bridge the gap between technical analysis and strategic execution is becoming a critical differentiator. Engaging a specialist speaker or investing in structured development can help teams move beyond raw numbers and learn to communicate insights in a way that drives measurable progress.
What Is Data Storytelling?
At its core, data storytelling is the practice of translating raw data analyses into layperson’s terms to influence a business decision or action. It is not merely about creating aesthetically pleasing charts or presenting a list of figures. Instead, it is the intersection of three distinct disciplines:
- Data Science: The objective analysis and extraction of insights from datasets.
- Visualisation: The presentation of data in a clear, digestible graphical format.
- Narrative: The structured flow of words and context that explains what the data means, why it matters, and what actions should follow.
When these three elements are combined effectively, data analysis storytelling turns abstract statistics into a compelling narrative arc. It helps stakeholders understand the “why” behind the “what,” transforming quiet numbers into active business tools.
Why Most Organisations Struggle With Data Storytelling
While many companies invest heavily in modern business intelligence (BI) tools, the return on investment often falls short because teams struggle to communicate their findings. Several key factors contribute to this struggle:
Confidence challenges
Many employees who work closely with data do not view themselves as communicators. Conversely, those in communication or leadership roles may feel intimidated by complex datasets. This mutual lack of confidence often leads to analytical insights being buried in technical jargon or ignored entirely.
Data literacy gaps
Data literacy is the ability to read, work with, analyze, and argue with data. When there is a mismatch in data literacy levels across an organisation, technical analysts and business decision-makers end up speaking different languages. Without a baseline level of literacy, storytelling with data becomes difficult to execute.
Data overload
In an effort to be thorough, teams often present every single metric they have gathered. This phenomenon sometimes called “infobesity” dilutes the core message. When stakeholders are bombarded with too many data points, they experience cognitive fatigue and struggle to identify the critical insights.
Communication issues
Technical experts are trained to focus on methodology, accuracy, and completeness. However, business leaders require brevity, relevance, and clear recommendations. Without proper training, presentations often focus too much on how the data was collected rather than what should be done with it. To resolve this disconnect, formal data storytelling training is often required to help technical and non-technical teams find a common ground.
Why Good Data Doesn’t Always Lead to Good Decisions
Even when organisations have access to high-quality, clean datasets, they frequently make suboptimal decisions. Access to data does not guarantee objective reasoning. Human cognitive biases and structural habits often distort how information is interpreted.
Outcome bias
Outcome bias occurs when a decision is evaluated solely on its ultimate result rather than the quality of the decision-making process at the time. If an organization makes a high-risk, poorly planned decision that happens to succeed due to luck, outcome bias leads them to believe it was a brilliant strategy. Conversely, a well-reasoned, data-backed decision that fails due to unpredictable external factors may be unfairly deemed a failure.
Hindsight bias
Often referred to as the “I knew it all along” phenomenon, hindsight bias leads individuals to believe, after an event has occurred, that they could have easily predicted it. In business, this can cause teams to overlook systemic risks in their data analysis, assuming past successes were entirely predictable and easily repeatable.
Confirmation bias
Perhaps the most common pitfall in corporate decision-making is confirmation bias. Decision-makers often enter a room with a pre-existing hypothesis and search specifically for data points that support their view, while ignoring conflicting evidence.
Misinterpreting trends
It is easy to mistake short-term fluctuations for long-term trends or to confuse correlation with causation. Without disciplined analytical frameworks, organisations risk making major strategic pivots based on temporary anomalies.
Over-reliance on dashboards
Dashboards are excellent for monitoring day-to-day operations, but they rarely tell a complete story. They show what is happening (e.g., “sales decreased by 12% this month”) but fail to explain why it is happening or how the business should respond. Relying solely on a dashboard to make complex decisions is like trying to drive a car while only looking at the speedometer.
Lack of context
Data collected in a vacuum is rarely useful. External variables such as macroeconomic shifts, competitor behavior, or changes in regulatory policy profoundly impact what the numbers mean. Without context, data can easily be misinterpreted, leading to misguided strategies.
Why Data Storytelling Matters for Leaders
For executives and managers, decision-making is a continuous process of risk management and resource allocation. Leaders do not have the time to sift through endless spreadsheets or interpret ambiguous charts.
Data storytelling matters because it:
- Saves Time: It delivers clear, concise insights that allow for faster, more confident decision-making.
- Builds Consensus: A well-structured narrative aligns diverse departments around a single, clear objective.
- Drives Action: By connecting logical data with human context, it inspires teams to execute strategy with a shared understanding of the goal.
The 5-Step Data Storytelling Framework
To consistently transform numbers into decisions, organizations can adopt a structured approach. This five-step framework provides a repeatable methodology for crafting impactful data narratives.
Step 1 – Define the Decision
Before opening a spreadsheet or drafting a slide, clarify the exact business decision that needs to be made. Starting with the end in mind prevents data exploration from devolving into a purposeless fishing expedition.
Step 2 – Collect Meaningful Data
Once the decision is defined, gather only the datasets that directly inform that decision. Filter out the noise and resist the temptation to include interesting but irrelevant metrics.
Step 3 – Analyse Trends and Patterns
Examine the selected data to identify shifts, anomalies, and correlations. This is where data analysis storytelling begins. Look for the underlying drivers behind the numbers and document the context surrounding them.
Step 4 – Build the Narrative
Structure your findings into a classic narrative arc:
- The Setup (Context): Establish the baseline situation.
- The Complication (The Problem): Introduce the challenge or opportunity revealed by the data.
- The Resolution (The Recommendation): Explain how the business can address the complication, using data as supporting evidence.
Step 5 – Drive Action
Conclude the presentation with clear, actionable recommendations. Clearly outline the next steps, the resource requirements, and the expected outcomes of the proposed decision.
Common Data Storytelling Mistakes
Even with the best intentions, narrative presentations can go astray. Being aware of these common pitfalls can help teams maintain objectivity and clarity:
- Outcome bias: Structuring a narrative to only praise successful outcomes, rather than evaluating the rigor and validity of the decision-making process itself.
- Hindsight bias: Rewriting the history of a project to make past outcomes look obvious, which prevents teams from honestly analyzing risk and uncertainty in future forecasts.
- Confirmation bias: “Cherry-picking” specific data points that support a pre-determined narrative or corporate agenda, while ignoring contrary data. This undermines the credibility of the entire analytical function.
- Overreliance on dashboards: Sending links to automated dashboards instead of doing the hard work of interpreting the data, isolating the key insights, and explaining them to stakeholders.
How Data Storytelling Training Builds Organisational Capability
Many leaders assume that simply hiring analytical talent will solve their communication problems. However, technical analytical skills and communication skills are rarely found in the same person without deliberate development.
Investing in structured data storytelling training helps build organisational capability by:
- Demystifying Data: Helping non-technical staff feel comfortable reading and questioning data.
- Standardising Processes: Providing teams with a shared framework and vocabulary to discuss insights, reducing friction between departments.
- Improving Efficiency: Equipping analysts with the skills to deliver concise, action-oriented reports, saving valuable executive time.
- Fostering a Data-Informed Culture: Shifting the organisation from making decisions based on “gut feel” to making decisions supported by clear, contextualized evidence.
Data Storytelling Examples for Schools, Corporates and NFPs
The principles of communicating with data apply across all sectors, though the specific objectives differ.
| Sector | The Raw Data | The Narrative (Data Storytelling in Action) | The Action Driven |
| Schools | Standardised test scores show a 15% drop in math performance in grade 4. | A transition to a new digital curriculum in grade 4 coincided with a drop in engagement, as students struggled with the interface. | Adjusting the curriculum implementation, re-allocating teacher training resources, and providing targeted math support. |
| corporate data storytelling | Customer churn increased by 8% in the third quarter. | Competitors launched a simplified onboarding process, while our own registration steps remained complex, leading to drop-offs. | Simplifying the user onboarding journey and prioritizing product design updates in the development roadmap. |
| NFPs (Non-profits) | Donor retention fell by 10% over the last year. | While one-off donations remained steady, regular monthly donors felt disconnected due to a lack of feedback on how their funds were spent. | Launching an automated impact-reporting email series for monthly donors to demonstrate transparency and rebuild trust. |
Choosing the Right Data Storytelling Training Program
When selecting a data storytelling training program for your team, look for programs that offer:
- Practical Application: Ensure the curriculum goes beyond theory to include hands-on workshops using your organization’s real datasets.
- Cross-Functional Design: The training should be accessible to both technical analysts who need to improve their communication skills and business leaders who need to improve their data literacy.
- Post-Training Support: Look for programs that offer ongoing coaching, follow-up sessions, or resources to help teams apply their new skills long-term.
- Customisation: A cookie-cutter approach rarely works. The training should be tailored to the specific challenges, maturity level, and industry of your organization.
Storytelling With Data in Practice
Implementing storytelling with data in your daily operations does not require a complete overhaul of your systems. Small, deliberate shifts in how information is shared can yield significant improvements:
- Ask “So What?” Three Times: For every chart or data point you plan to present, ask yourself “so what?” until you reach the fundamental business impact.
- Declutter Visuals: Remove unnecessary gridlines, legends, and 3D effects from your charts. Keep the focus entirely on the key data point you want the audience to see.
- Lead with the Headline: Instead of naming a slide “Q3 Revenue Analysis,” use an active headline like “Q3 Revenue Increased by 5% Due to Strong Regional Sales.”
FAQ
What is the difference between data visualization and data storytelling?
Data visualization is the graphic representation of data (such as charts, graphs, and maps). Data storytelling goes a step further by wrapping those visual representations in a structured narrative that explains why the trends occurred and what actions should be taken as a result.
Why is data storytelling important for leadership?
Leaders are rarely closer to the day-to-day data than their analytical teams, yet they bear the responsibility for high-stakes decisions. Data storytelling translates complex analyses into clear options, risks, and trade-offs, enabling faster and more aligned strategic moves.
Can anyone learn data storytelling, or do you need a background in math?
Anyone can learn data storytelling. It is a communication skill rather than a purely technical mathematical skill. While basic data literacy is helpful, the training focuses on structured thinking, narrative design, and understanding human psychology.
How long does it take to see results from data storytelling training?
While mastering the skill takes practice, organizations often notice immediate improvements in the clarity of presentations, shorter and more productive meetings, and better alignment on key decisions within weeks of completing a structured training program.
Conclusion
Data is one of the most powerful assets your organisation owns but only if people can understand it and act on it.
Too many teams are still buried in spreadsheets, sitting through reports that go nowhere. That gap between data and decision is not a technology problem. It is a communication problem and data storytelling is the solution.
When you build a culture of structured narrative around your numbers, meetings become sharper, strategies become clearer, and leaders stop asking “what does this mean?” and start asking “what do we do next?”
Whether you are an analyst, marketer, educator, or business leader the next step is the same. Learn to tell the story behind your data.
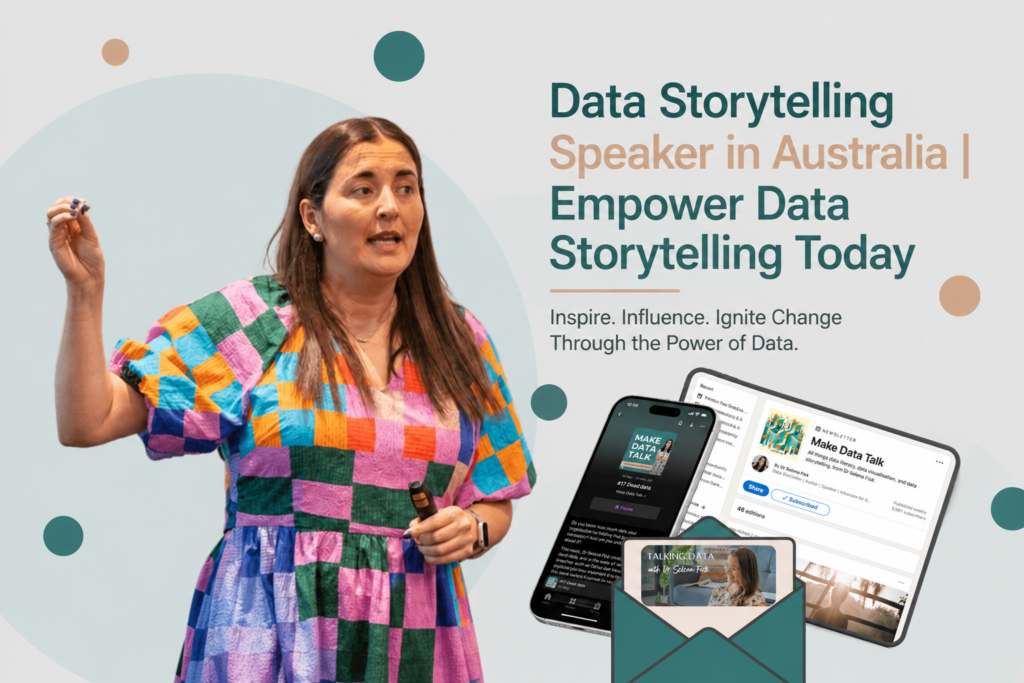
That is exactly what Dr. Selena Fisk helps professionals and teams do every day. Through her data storytelling training and keynotes, she works with organisations who are done with data that sits in spreadsheets and are ready for insights that actually drive decisions.
Your data has a story. Dr. Selena Fisk helps you tell it properly.