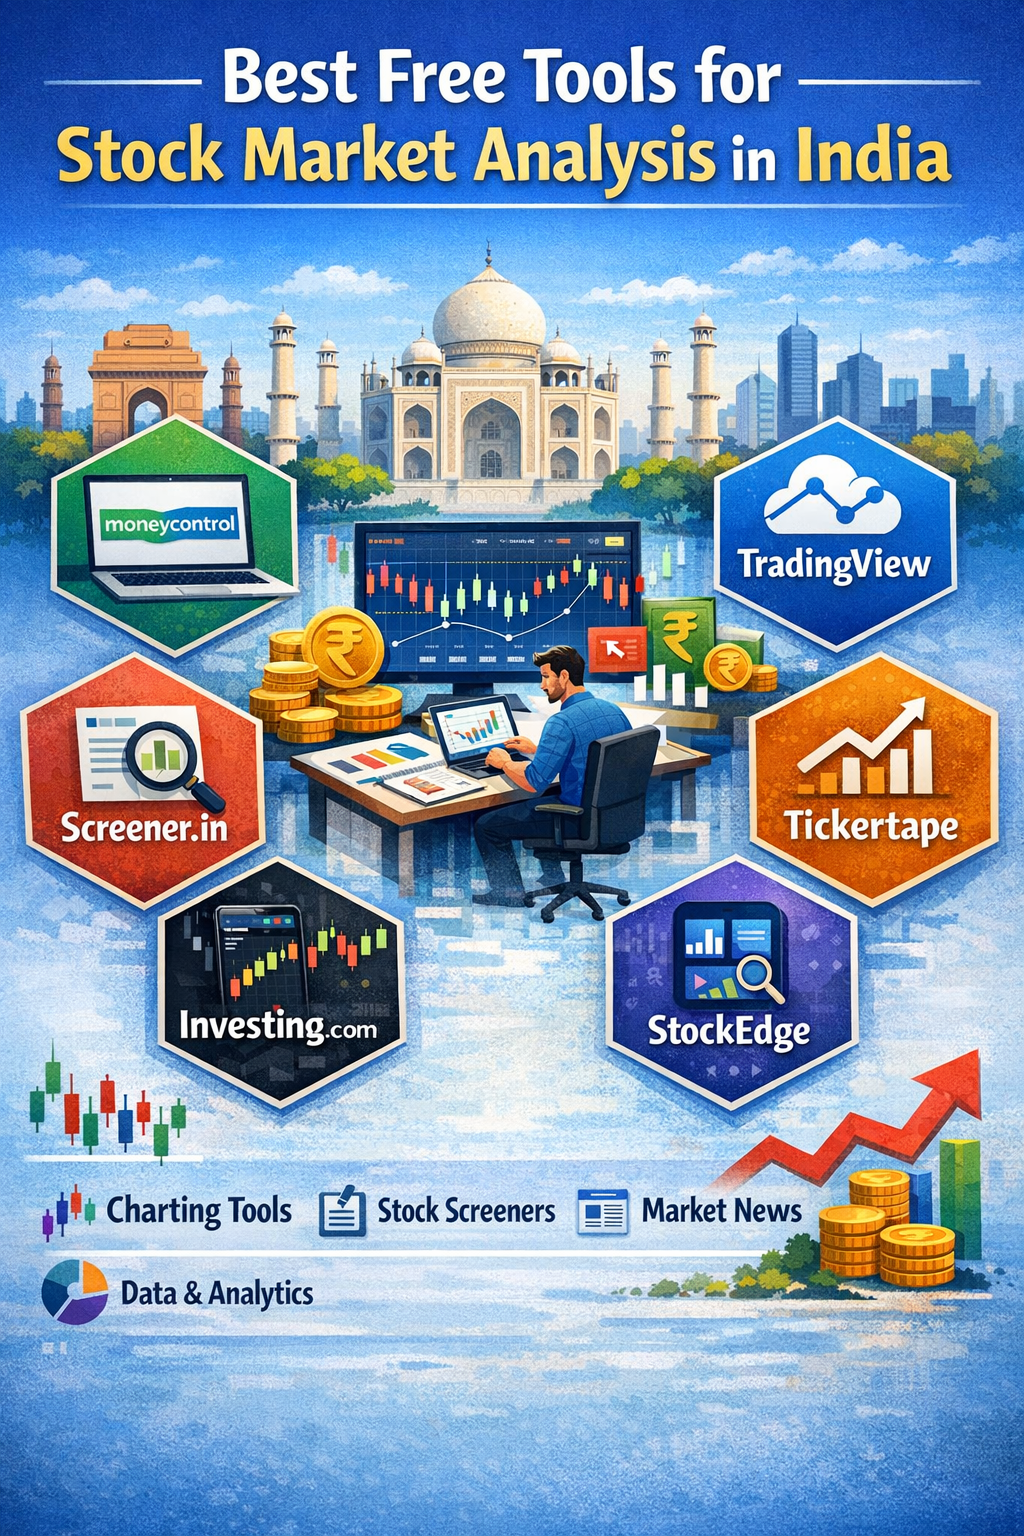
Discover India’s best free tools for smarter stock market analysis — from charting and screening to real-time insights. Empower your investing journey with platforms like Moneycontrol, TradingView, Screener.in, Tickertape, Investing.com, and StockEdge.
1. Introduction
In today’s fast-moving financial markets, having access to the right stock market analysis tools India is essential for making informed decisions. Whether you are a beginner or an experienced trader, data-driven platforms help you understand price movements, trends, and market sentiment effectively.
With the rise of free trading tools India, retail investors now have access to powerful features like charting, option chain analysis, and real-time market data without paying high fees. These tools simplify complex market information and make analysis more accessible.
In this article, we will explore the best stock market tools available for free in India and how you can use them effectively for better market understanding.
2. Why Stock Market Tools Are Important
Stock market tools play a crucial role in improving trading and investment decisions. Here’s why:
Data-Driven Decisions
Instead of guessing, traders can rely on charts, indicators, and financial data.
Time-Saving
Tools automate calculations and provide ready insights, saving hours of manual work.
Accuracy in Trading
Better data interpretation leads to more informed and structured decisions.
3. Types of Stock Market Analysis Tools
Understanding different types of tools helps in choosing the right combination.
Technical Analysis Tools
Used for chart patterns, indicators, and price action analysis.
Fundamental Analysis Tools
Focus on company financials, earnings, and valuation.
Derivatives Tools
Help analyze options, futures, and open interest data.
Market Sentiment Tools
Track investor behavior, news trends, and overall market mood.
4. Best Free Tools for Stock Market Analysis in India
Tool 1: Charting Platforms
Charting platforms are among the most important technical analysis tools.
Features
- Candlestick charts
- Indicators like RSI, MACD
- Trendlines and drawing tools
Benefits
- Helps identify entry and exit points
- Useful for intraday and swing trading
- Visual representation of price action
Popular free charting tools include TradingView (free version) and broker-based platforms.
Tool 2: Option Chain Tools
Option chain tools are essential for derivatives trading.
Importance
They show call and put data, open interest, and strike prices.
Traders often use sensex option chain data to understand market direction, support and resistance levels, and institutional activity.
Benefits
- Identify strong support/resistance
- Understand market sentiment
- Useful for options strategies
Tool 3: IPO Tracking Tools
IPO tracking tools help investors monitor upcoming and ongoing IPOs.
What They Show
- Issue details
- Subscription data
- Listing expectations
Many investors track ipo gmp to understand grey market sentiment before listing. While it is unofficial, it gives an idea of demand.
Benefits
- Better IPO decision-making
- Understanding market interest
- Early insights into listing expectations
Tool 4: Index Tracking Tools
Index tracking tools provide a broader view of the market.
Importance
Tracking indices like nifty 50 helps understand overall market trends.
Benefits
- Market direction analysis
- Sector performance tracking
- Benchmark comparison
Tool 5: Open Interest & Derivatives Tools
These tools focus on futures and options data.
Features
- Open interest analysis
- PCR (Put Call Ratio)
- Futures data
Benefits
- Helps identify trend strength
- Useful for derivatives traders
- Supports strategy building
Tool 6: News & Research Platforms
Market news plays a key role in stock movement.
Features
- Real-time news updates
- Expert analysis
- Economic data
Benefits
- Stay updated with market events
- Understand macro trends
- Improve decision-making
5. How to Choose the Right Tool
Choosing the right tool depends on your trading style.
Based on Trading Style
- Intraday traders need fast charting tools
- Investors prefer fundamental platforms
Beginner vs Advanced
- Beginners should use simple interfaces
- Advanced users can explore complex indicators
Free vs Premium
- Free tools are enough for learning
- Premium tools offer advanced features
6. Common Mistakes While Using Tools
Over-Reliance on One Tool
Using only one indicator can lead to biased decisions.
Ignoring Fundamentals
Technical tools alone are not enough for long-term investing.
Misinterpreting Data
Incorrect understanding of charts or option data can lead to poor decisions.
7. Combining Multiple Tools for Better Analysis
Using multiple tools improves accuracy.
Chart + Option Chain
Helps confirm price trends with derivatives data.
Sentiment + Data
Combining news with technical indicators gives better insights.
Strategy Building
Using different tools helps create structured trading strategies.
8. Limitations of Free Tools
While free trading tools India are useful, they have some limitations:
Limited Features
Advanced indicators may be restricted.
Data Delay
Some platforms provide delayed data.
Accuracy Issues
Not all tools offer institutional-level precision.
9. Practical Example
Let’s understand how tools work together:
- Use a charting platform to identify trend
- Check option chain data for support/resistance
- Track index movement for overall direction
- Read news for sentiment
This combination helps create a more informed trading decision rather than relying on a single source.
10. FAQ Section
1. Which are the best free stock market tools in India?
Some of the best stock market tools include charting platforms, option chain tools, IPO trackers, and news platforms.
2. Can beginners use free trading tools?
Yes, most free trading tools India are beginner-friendly and provide easy-to-understand data.
3. What is sensex option chain used for?
It helps traders analyze options data, identify support/resistance, and understand market sentiment.
4. How does ipo gmp help investors?
It gives an informal idea of IPO demand and possible listing expectations.
5. Why is nifty 50 important?
It represents the performance of top 50 companies and reflects overall market trends.