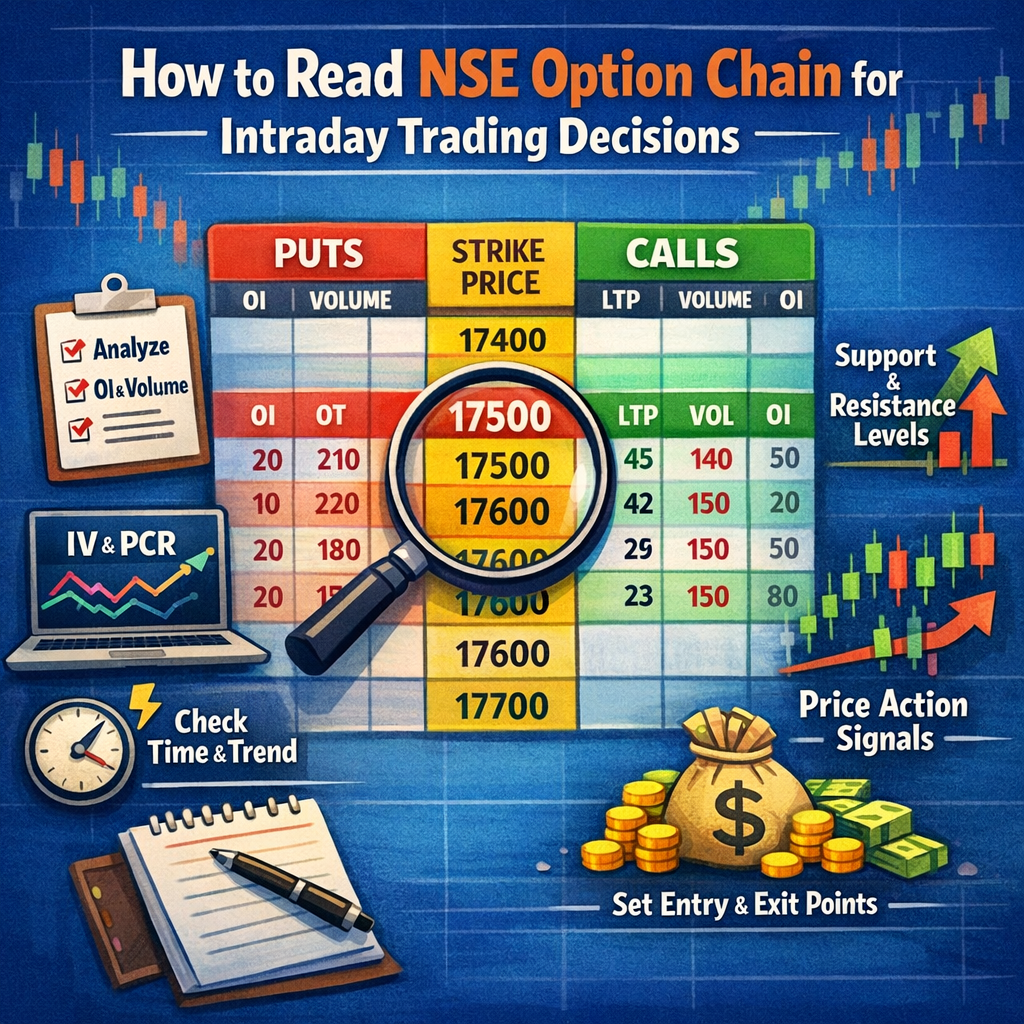
Master intraday trading with this visual guide to decoding the NSE option chain — from strike price analysis to entry and exit strategies.
1. Introduction
In the world of derivatives trading India, understanding market sentiment is crucial—especially for intraday traders. One of the most powerful tools available is NSE option chain analysis, which helps traders decode market positioning in real time.
If you are learning how to read option chain, it can significantly improve your intraday trading decisions by identifying support, resistance, and trend direction. Instead of relying only on price charts, option chain data gives insight into where big market participants are placing their bets.
This article will guide you step-by-step in a simple and beginner-friendly way.
2. What Is NSE Option Chain?
The option chain is a structured table that displays all available option contracts for a particular index or stock, such as Nifty or Bank Nifty. You can access the nse option chain to view real-time data on calls and puts across different strike prices.
Key Elements:
- Call Options (CE): Represent bullish bets
- Put Options (PE): Represent bearish bets
- Strike Price: The price at which the contract can be exercised
- Open Interest (OI): Number of outstanding contracts
- Market Data: Includes volume, price, and implied volatility
This structured data is the foundation of option chain data explained in trading.
3. Key Components of Option Chain
To master NSE option chain analysis, you need to understand its core components:
1. Open Interest (OI)
Shows the number of active contracts in the market.
2. Volume
Indicates how many contracts were traded during the day.
3. Implied Volatility (IV)
Represents expected future volatility.
4. Change in OI
Shows whether new positions are being added or closed.
Together, these elements act as a trader sentiment indicator and help decode market direction.
4. Understanding Open Interest (OI)
Open Interest is one of the most important metrics in open interest analysis. It tells you where traders are building positions.
Using oi data, traders can identify:
- Strong buying or selling zones
- Market participation
- Trend strength
How OI Works:
- Increasing OI + Price Rising → Strong Uptrend
- Increasing OI + Price Falling → Strong Downtrend
- Decreasing OI → Position unwinding
This helps traders better understand market positioning rather than guessing price movement.
5. How to Identify Support and Resistance
One of the most practical uses of support and resistance in options is identifying key levels using option chain data.
Support (Put Side)
- Strike price with highest Put OI
- Indicates strong buying interest
Resistance (Call Side)
- Strike price with highest Call OI
- Indicates strong selling pressure
Example:
If Nifty shows highest Put OI at 22,000 → strong support
If highest Call OI is at 22,500 → strong resistance
These levels form the basis of a Nifty option chain strategy.
6. Intraday Trading Strategy Using Option Chain
For effective intraday trading decisions, option chain data can be used in multiple ways:
1. Breakout Strategy
- Price breaks resistance with rising OI
- Indicates strong bullish momentum
2. Reversal Signals
- High OI at a level but price fails to cross
- Indicates possible reversal
3. Trend Continuation
- OI builds along with price movement
- Confirms trend strength
By combining these signals, traders can make more informed entries and exits.
7. Combining Option Chain with Other Indicators
Option chain should not be used in isolation. Combining it with other tools improves accuracy.
Combine With:
- Price action
- Volume analysis
- Global market cues
Example Insight
Suppose option chain shows strong resistance at a level, but global commodities like Silver Rate Today in Ahmedabad are rising sharply, indicating inflationary pressure. This external factor may influence market sentiment and lead to a breakout despite resistance.
This type of cross-market analysis enhances decision-making.
8. Common Mistakes Traders Make
Even though NSE option chain analysis is powerful, traders often misuse it.
Mistakes to Avoid:
- Ignoring overall market trend
- Relying only on OI without price confirmation
- Misinterpreting sudden spikes in data
- Overtrading based on small signals
Avoiding these mistakes is essential for consistency.
9. Limitations of Option Chain Analysis
While useful, option chain data has limitations:
Key Limitations:
- Data Lag: Slight delay in updates
- News Impact: Sudden events can override data
- False Signals: OI shifts may not always predict movement
This is why it should be used along with other indicators.
10. Practical Example
Let’s understand with a simple scenario:
Step 1: Check Option Chain
- Identify highest Call and Put OI
Step 2: Analyze Trend
- Observe price movement with OI changes
Step 3: Plan Trade
- Enter near support in uptrend
- Exit near resistance
Step 4: Confirmation
- Use volume and price action
This step-by-step approach simplifies how to read option chain effectively.
11. FAQ Section
1. How to read nse option chain?
Start by identifying strike prices, then analyze OI, volume, and change in OI to understand market sentiment.
2. What is oi data in trading?
It represents the number of open contracts and helps track market participation and trend strength.
3. How to identify support and resistance?
Look for highest Put OI (support) and highest Call OI (resistance).
4. Can option chain predict intraday moves?
It provides insights into market positioning but does not guarantee outcomes.
5. How to use option chain with other indicators?
Combine it with price action, volume, and global cues for better accuracy.