Triangle Pattern in Trading
Triangle Pattern in Trading: A Complete Guide
Introduction
If you are diving into stock trading, you’ve probably heard about technical analysis. One of the most powerful and commonly used patterns in trading is the Triangle Pattern. But what is it, and how can it help you make better trading decisions? Let’s break it down in simple terms.
A triangle pattern is like a roadmap in stock charts that helps traders predict future price movements. It forms when a stock’s price consolidates into a shape resembling a triangle before making a breakout. Understanding this pattern can help traders maximize their profits while minimizing risks.
Learn about Triangle Patterns in Trading. Enhance your skills with the best stock market training in Bangalore & stock market course in Bangalore.
What is a Triangle Pattern?
A triangle pattern is a chart formation that signals a continuation or reversal of the current trend. It occurs when the stock price moves into a tighter range, forming a triangle shape. Traders watch for a breakout, which helps them decide when to enter or exit a trade.
Types of Triangle Patterns
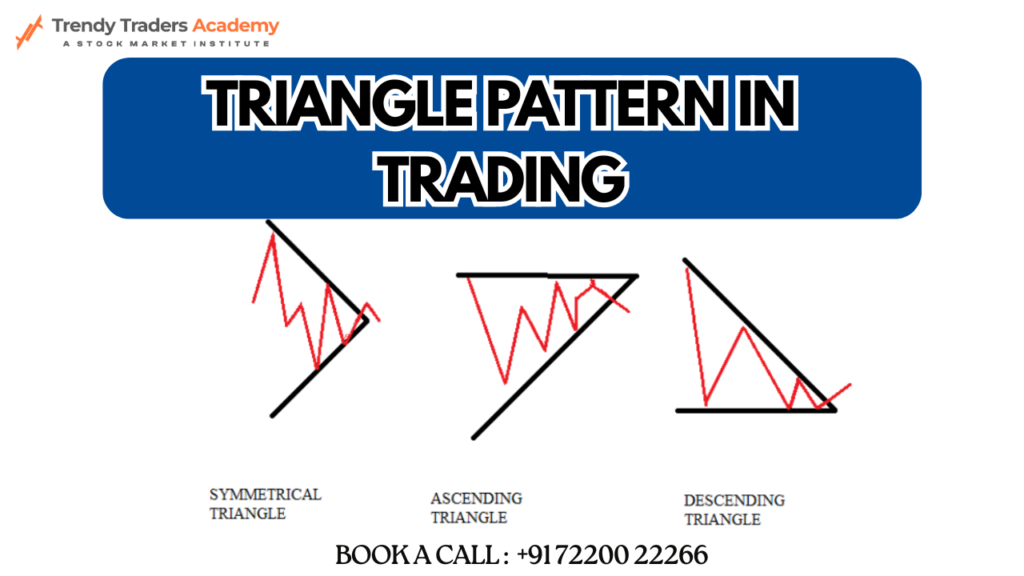
Triangle patterns come in three main types:
- Ascending Triangle – A bullish pattern signaling an upward breakout.
- Descending Triangle – A bearish pattern indicating a downward breakout.
- Symmetrical Triangle – A neutral pattern that can break out in either direction.
Ascending Triangle Pattern
An ascending triangle is a bullish continuation pattern that occurs when the price forms higher lows while facing resistance at a horizontal level. It indicates that buyers are gaining strength, and a breakout above resistance is likely.
How to Trade an Ascending Triangle?
- Wait for a breakout above resistance before entering a trade.
- Set a stop-loss below the recent higher low.
- Use the measured move technique to set a profit target.
Descending Triangle Pattern
A descending triangle is a bearish pattern where the price forms lower highs while finding support at a horizontal level. This suggests sellers are in control and a breakdown is likely.
How to Trade a Descending Triangle?
- Enter a short trade when price breaks below support.
- Place a stop-loss above the recent lower high.
- Set a target based on the height of the triangle.
Symmetrical Triangle Pattern
A symmetrical triangle forms when both support and resistance lines converge, creating a neutral pattern. This signals that neither buyers nor sellers are in control, and the breakout can occur in either direction.
How to Trade a Symmetrical Triangle?
- Watch for a breakout in either direction.
- Enter a trade once the breakout is confirmed.
- Use a stop-loss to manage risk.
How to Identify Triangle Patterns?
To spot a triangle pattern:
- Look for converging trendlines.
- Observe lower highs or higher lows.
- Watch for breakouts with volume.
Trading Strategies for Triangle Patterns
- Breakout Trading: Enter a trade after confirmation of a breakout.
- Retest Strategy: Wait for the price to retest the breakout level before entering.
- Volume Confirmation: Look for increased volume to confirm breakout strength.
Risk Management with Triangle Patterns
- Always set a stop-loss to prevent major losses.
- Use proper position sizing.
- Avoid trading on false breakouts.
Common Mistakes to Avoid
- Entering a trade before confirmation.
- Ignoring volume analysis.
- Not using a stop-loss.
Best Tools for Identifying Triangle Patterns
- TradingView
- MetaTrader 4 & 5
- ThinkorSwim
Real-Life Examples of Triangle Patterns
Analyzing past stock charts helps in understanding triangle patterns better. Some famous stocks like Tesla and Apple have shown these patterns before major price moves.
Why Learn Triangle Patterns in a Stock Market Course?
A structured stock market course in Bangalore helps you master triangle patterns with real-life case studies and practical trading strategies.
Best Stock Market Training in Bangalore
Bangalore offers various stock market training programs covering technical analysis, trading strategies, and risk management to help you succeed in trading.
Conclusion & Key Takeaways
Triangle patterns are essential tools in trading. Understanding and applying them correctly can help traders make more informed decisions. If you’re serious about trading, consider enrolling in a stock market training in Bangalore to learn from experts.
FAQs on Triangle Patterns in Trading
What is the best time frame to trade triangle patterns?
Triangle patterns work on all timeframes, but they are most effective on daily and hourly charts.
Can triangle patterns be used in forex trading?
Yes, triangle patterns are widely used in forex, stocks, and cryptocurrency trading.
How reliable are triangle patterns?
Triangle patterns have a high success rate when combined with volume analysis and proper risk management.
How do I avoid false breakouts in triangle patterns?
Use volume confirmation and wait for a retest of the breakout level before entering a trade.
Where can I learn more about triangle patterns?
Enroll in a stock market course in Bangalore to gain hands-on experience and expert insights.